iOS 使用 Core Plot 绘制统计图表入门
iOS(iPhone/iPad) 下图形组件有两个有名的,s7graphview 和
Core Plot,
它们都是在 Google 上托管的代码,听说 Core Plot 比较强,因为前者仅支持曲线图,后者呢曲线图、饼图、柱状图等通吃,且较活跃。那就专注下 Core Plot 的使用。
它提供了 Mac OS X 和 iOS 下的组件库,我只用到它的 iOS 图表库。
Core Plot 能画出来图表的效果应该多看看:http://code.google.com/p/core-plot/wiki/PlotExamples,相信看过之后绝大多数的 iOS 下的图表可以用它来满足你了。
配置其实很简单的,先从 http://code.google.com/p/core-plot/downloads/list 下载最新版的 Core Plot,比如当前是:CorePlot_0.4.zip,解压开,然后就两步:
1. 把目录 CorePlot_0.4/Binaries/iOS 中的 libCorePlotCocoaTouch.a 和整个子目录 CorePlotHeaders 从 Finder 中一并拖入到当前项目中, 选择 Copy item into destination group's folder (if needed),Add to targets 里选上相应的 target。 此时你可以在项目的 target 中 Build Phases 页里 Link Binary With Libraries 中看到有了 libCorePlot-CocoaTouch.a.
2. 再到相应 Target 的 Build Settings 页里,Other Linker Flags 项中加上 -ObjC -all_load
[注]我所用的 Xcode 是 4.1 版本的。Xcode 3 的 Target 设置项位置稍有不同。
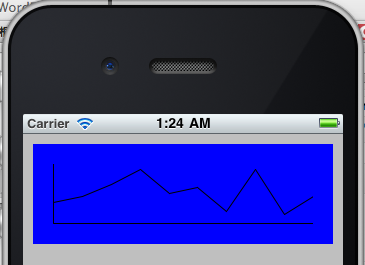
配置就这么完成了,使用时只需要 #import "CorePlot-CocoaTouch.h",下面来体验一个最简单的例子,下载的 CorePlot 包中虽然有一些例子,但还是需要一个能让人好理解并获得最快速体验的。 比如像这下图中这么一个最简单的曲线图,最基本的代码要素应该有哪些呢?
主要代码就是下面那样:
关于更详细的 Core Plot 使用,下面还会继续作介绍的。
参考:1. http://www.e-string.com/content/simple-graph-using-core-plot
2. http://www.e-string.com/content/simple-bar-chart-core-plot
3. http://www.jaysonjc.com/programming/pie-chart-drawing-in-iphone-using-core-plot-library.html 永久链接 https://yanbin.blog/ios-coreplot-chart-started/, 来自 隔叶黄莺 Yanbin's Blog
[版权声明] 本文采用 署名-非商业性使用-相同方式共享 4.0 国际 (CC BY-NC-SA 4.0) 进行许可。
Core Plot 能画出来图表的效果应该多看看:http://code.google.com/p/core-plot/wiki/PlotExamples,相信看过之后绝大多数的 iOS 下的图表可以用它来满足你了。
配置其实很简单的,先从 http://code.google.com/p/core-plot/downloads/list 下载最新版的 Core Plot,比如当前是:CorePlot_0.4.zip,解压开,然后就两步:
1. 把目录 CorePlot_0.4/Binaries/iOS 中的 libCorePlotCocoaTouch.a 和整个子目录 CorePlotHeaders 从 Finder 中一并拖入到当前项目中, 选择 Copy item into destination group's folder (if needed),Add to targets 里选上相应的 target。 此时你可以在项目的 target 中 Build Phases 页里 Link Binary With Libraries 中看到有了 libCorePlot-CocoaTouch.a.
2. 再到相应 Target 的 Build Settings 页里,Other Linker Flags 项中加上 -ObjC -all_load
[注]我所用的 Xcode 是 4.1 版本的。Xcode 3 的 Target 设置项位置稍有不同。
配置就这么完成了,使用时只需要 #import "CorePlot-CocoaTouch.h",下面来体验一个最简单的例子,下载的 CorePlot 包中虽然有一些例子,但还是需要一个能让人好理解并获得最快速体验的。 比如像这下图中这么一个最简单的曲线图,最基本的代码要素应该有哪些呢?
主要代码就是下面那样:
 1//
 2//  Created by Unmi Qiu on 8/11/11.
 3//  Copyright 2011 . All rights reserved.
 4//
 5
 6#import <UIKit/UIKit.h>
 7#import "CorePlot-CocoaTouch.h"
 8
 9@interface TestCorePlotViewController : UIViewController<CPTPlotDataSource> {
10    NSMutableArray *dataArray;
11}
12@end
13
14@implementation TestCorePlotViewController
15
16#pragma mark - View lifecycle
17
18- (void) viewDidAppear:(BOOL)animated {
19
20    //初始化数组,并放入十个 0 - 20 间的随机数
21    dataArray = [[NSMutableArray alloc] init];
22    for(int i=0; i< 10; i++){
23        [dataArray addObject:[NSNumber numberWithInt:rand()%20]];
24    }
25
26    CGRect frame = CGRectMake(10,10, 300,100);
27
28    //图形要放在一个 CPTGraphHostingView 中,CPTGraphHostingView 继承自 UIView
29    CPTGraphHostingView *hostView = [[CPTGraphHostingView alloc] initWithFrame:frame];
30
31    //把 CPTGraphHostingView 加到你自己的 View 中
32    [self.view addSubview:hostView];
33    hostView.backgroundColor = [UIColor blueColor];
34
35    //在 CPTGraph 中画图,这里的 CPTXYGraph 是个曲线图
36    //要指定 CPTGraphHostingView 的 hostedGraph 属性来关联
37    CPTXYGraph *graph = [[CPTXYGraph alloc] initWithFrame:hostView.frame];
38    hostView.hostedGraph = graph;
39
40    CPTScatterPlot *scatterPlot = [[CPTScatterPlot alloc] initWithFrame:graph.bounds];
41    [graph addPlot:scatterPlot];
42    scatterPlot.dataSource = self; //设定数据源,需应用 CPTPlotDataSource 协议
43
44    //设置 PlotSpace,这里的 xRange 和 yRange 要理解好,它决定了点是否落在图形的可见区域
45    //location 值表示坐标起始值,一般可以设置元素中的最小值
46    //length 值表示从起始值上浮多少,一般可以用最大值减去最小值的结果
47    //其实我倒觉得,CPTPlotRange:(NSRange) range 好理解些,可以表示值从 0 到 20
48    CPTXYPlotSpace *plotSpace = (CPTXYPlotSpace *) scatterPlot.plotSpace;
49    plotSpace.xRange = [CPTPlotRange plotRangeWithLocation:CPTDecimalFromFloat(0)
50                                                    length:CPTDecimalFromFloat([dataArray count]-1)];
51    plotSpace.yRange = [CPTPlotRange plotRangeWithLocation:CPTDecimalFromFloat(0)
52                                                    length:CPTDecimalFromFloat(20)];
53
54    //下面省去了坐标与线型及其他图形风格的代码
55
56    [plotSpace release];
57    [graph release];
58    [hostView release];
59}
60
61//询问有多少个数据,在 CPTPlotDataSource 中声明的
62- (NSUInteger) numberOfRecordsForPlot:(CPTPlot *)plot {
63    return [dataArray count];
64}
65
66//询问一个个数据值,在 CPTPlotDataSource 中声明的
67- (NSNumber *) numberForPlot:(CPTPlot *)plot field:(NSUInteger)fieldEnum recordIndex:(NSUInteger)index {
68    if(fieldEnum == CPTScatterPlotFieldY){    //询问 Y 值时
69        return [dataArray objectAtIndex:index];
70    }else{                                    //询问 X 值时
71        return [NSNumber numberWithInt:index];
72    }
73}
74
75- (void) dealloc {
76    [dataArray release];
77    [super dealloc];
78}
79
80@end
关于更详细的 Core Plot 使用,下面还会继续作介绍的。
参考:1. http://www.e-string.com/content/simple-graph-using-core-plot
2. http://www.e-string.com/content/simple-bar-chart-core-plot
3. http://www.jaysonjc.com/programming/pie-chart-drawing-in-iphone-using-core-plot-library.html 永久链接 https://yanbin.blog/ios-coreplot-chart-started/, 来自 隔叶黄莺 Yanbin's Blog
[版权声明]
本文采用 署名-非商业性使用-相同方式共享 4.0 国际 (CC BY-NC-SA 4.0) 进行许可。